Posts

Showing posts with the label PendingOrders

The Neck Candlestick Pattern

Image
What is in The Neck Candlestick Pattern? The pattern at the neckline occurs when a long real-body bearish candle is followed by a smaller real-body rising candle that widens at the open but then closes near the close of the previous candle. The pattern is called a cleavage because the two closes are the same (or nearly the same) on both candles, forming a horizontal cleavage. In theory, the pattern is considered a continuation pattern, which indicates that the price will continue to fall following the pattern. In reality, this only happens half the time. As such, the pattern often suggests at least a short-term bullish reversal. What Does the Neckline Candlestick Pattern tell Traders? The candlestick pattern at the neckline informs traders of the possibility of the current trend in the market continuing. If the study is exhaustive, it also sheds light on the general behavior of the market in which it occurs. The appearance of the first bearish candle indicates the strength of the bears...

Tweezer Bottom and Top Candlestick Patterns

Image
How to Trade the Tweezer Bottom and Top Candlestick Patterns. The depth of the lower shadows of this signal indicates a support zone. The bears were unwilling to sell below that low price, so the bulls came back with great force, driving the price higher. The fact that two or more shadow candles have formed at the same level confirms the strength of the support and shows that the downtrend is likely to continue or turn into an uptrend.  Like the high tweezers, this signal is considered a short-term minor reversal pattern. To better understand its meaning, pay attention to these characteristics: 1When this model appears at the bottom of the market, it is more reliable. 2If the first candle has a high body and the second one has a short body, then the reversal will be more reliable. 3If the bottom of the tweezer is followed by another reversal pattern, such as B. an engulfing or bullish piercing pattern, with identical lows, this is even more reliable. The Tweezers Top and Tweezers B...

Three White Soldiers

Image
  Three White Soldiers Definition The Three White Soldiers candlestick pattern is unusual in that its meaning depends on its context. However, the pattern itself is easy to spot. This training is simply three days in a row with a white candle, each higher than the last. The apparition is of three white soldiers standing in a row, hence the name. The bullish significance of this formation is easy to guess. But how reliable is this indicator?   This indicator is quite strong and very reliable in most situations, indicating an accumulation of bullish strength. For example, when a market is flat or moving mostly sideways, the three white soldiers indicate that the bulls are gaining ground. When the market has entered a downtrend, this candlestick pattern indicates a reversal. However, when the market is constantly progressing, the three white soldiers are considered less important. That's because they fit the current blueprint and aren't even really considered a sequel.   How...

Harmonious patterns in the currency markets.

Image
  Harmonious patterns in the currency markets. Harmonious price patterns identify the phases of a pullback so that once the pattern completes, you have a clear signal to buy or sell. Retracements are boring at any time, and any help is always welcome, although, with harmonic trajectory patterns, the orthodoxy is to apply for Fibonacci numbers. Again, Fibonacci numbers are not a proven theory and in fact, there is a lot of evidence that Fibonacci numbers only appear as often as chance allows in stock prices, forex included. However, when a perfect or near-perfect Fibonacci number appears, many traders will see it and get the expected result, so Fibonacci-based trading ideas are not worth dismissing. How can these harmonious patterns help you improve your trading strategy? Depending on the reason (each reason can tell a different story), they can be a clue to: Reversal Pattern - Predicts that the price will reverse and move in the opposite direction. Reason for continuation: predicts...

Bollinger Bands

Image

COMMODITIES TRADING

Image
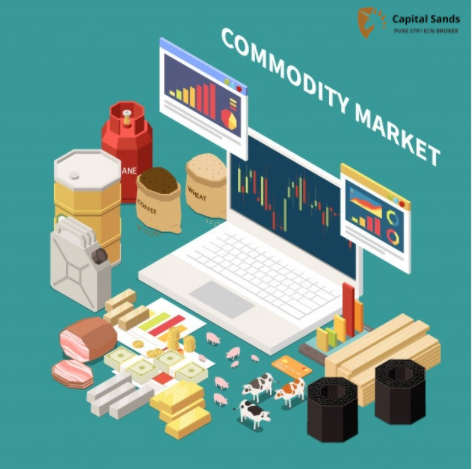
 What is Commodities Trading? A commodity refers to any material that has its own intrinsic value and can be exchanged for money or other goods and services. Investment and trade-related commodities include fuels, agricultural products, and metals, etc., which are traded in bulk on a spot market or on a commodity exchange. There are two kinds of raw materials on the market, namely hard raw materials and soft raw materials. Hard raw materials are often used as inputs for the manufacture of other goods and the provision of services, while soft raw materials are used mainly for initial consumption. Inputs such as metals and minerals are classified as hard raw materials, while agricultural products such as rice and wheat are softer raw materials. Since different manufacturers produce the goods available on the bags, the quality is different, but according to some criteria it has to be essentially the same for different manufacturers. Commodities are traded on the spot market or on the ...

Stock Market

Image
How does the stock market work? If the idea of   investing in the stock market scares you, you are not alone. People with very limited experience in investing in stocks are afraid of horror stories in which the average investor will lose 50% of the value of their portfolio, for example, in the two bear markets that have already appeared during this period. Millennial1, or are attracted to "good deals," which promise great rewards but rarely pay off, so it is not surprising that the investment mood pendulum swings between fear and greed. Definition of "share" A share (also called "equity" of a company) is a financial instrument that represents the ownership of a company or corporation and represents a proportional claim on its assets (what it owns) and its earnings (what it owns). Participation means that the shareholder owns a stake in the company equal to the number of shares compared to the total number of shares outstanding in the company. For example, ...