Posts

Showing posts with the label cfds

Bearish Counter-Attack Candlestick Pattern

Image
What are bearish  counterattack lines? The Counterattack Lines Pattern is a two-candle reversal pattern that appears on candlestick charts. This can happen during an uptrend or downtrend. In a bullish reversal during a downtrend, the first candle is a long black candle (low) and the second candle pulls away but then closes higher near the close of the first candle. This shows that sellers were in control, but could lose control as buyers could fill the void. In a bear reversal during an uptrend, the first candle is a long white (rising) candle and the second candle goes up but then closes lower near the close of the first candle. Counterattack candlestick pattern: an example Understanding the model and what it means becomes much easier when you see it in action. So let's take a look. This is what the bullish counterattack pattern looks like. Take a moment to look at this figure. The bearish candlestick is black while the bullish candlestick is white. Here you can see that prices ar...

Morning Star

Image
 The Morning Star For the sake of simplicity, a bearish candlestick is one in which the stock's closing price is lower than its opening price, meaning that the price has fallen during the day. In contrast, a bullish candlestick is one where the closing price is higher than the opening price because the price has risen throughout the day. With that in mind, let us know as we take a closer look at the construction and key features of this popular candlestick pattern. What is the difference between Morning Star and Evening Star candlestick patterns? The main difference between the Morning Star and Evening Star candlestick patterns is that the Morning Star is considered a bullish indicator, while the Evening Star is considered a bearish indicator. The Evening Star has the center candle at a higher high than the two side candles with a gap up followed by a gap down, while the Morning Star has the center candle at its highest low with a gap down followed by a gap up. An example of a morn...

Bullish Engulfing Pattern.

Image
  What is a Bullish Engulfing Pattern? A bullish engulfing pattern is a white candlestick that closes above the previous day's open after opening below the previous day's close. It can be recognized when a small black candlestick indicating a downtrend is followed the next day by a large white candlestick indicating an uptrend, the body of which completely covers or engulfs the body of the previous day's candlestick. A bullish engulfing pattern can be contrasted with a bearish engulfing pattern. With a single candlestick pattern, the trader only needed one candlestick to spot a trading opportunity. However, when analyzing multiple candlestick patterns, the trader needs 2 or sometimes 3 candlesticks to identify a trading opportunity. This means that the trading opportunity develops for at least 2 trading sessions. What Is a Bullish Engulfing Pattern? To find bullish engulfing patterns, look for these two candlesticks side by side: A small red candlestick, usually at the end ...

Candlestick Chart

Image
 The 3 Most Powerful Candlestick Chart Patterns Candlestick charts are a technical tool that groups data from multiple timeframes into individual price bars. This makes them more useful than traditional open-high, low-close bars or simple lines connecting closing price points. Candlesticks form patterns that predict the direction of prices when they end. Proper color coding adds depth to this colorful technical tool, which dates back to 18th-century Japanese rice traders. Steve Nison introduced Japanese candlestick patterns to the Western world in his popular 1991 book, Candlestick Charting Techniques.1 Many traders today can identify dozens of these patterns, which have colorful names like bearish cloud cover, evening star, and bearish cloud cover. three black ravens. Additionally, single bar patterns including Doji and Hammer have been incorporated into dozens of long and short trading strategies. 1. Spinning Top When trading stock markets or other liquid and risky asset classes,...

Accumulation Distribution Indicator

Image
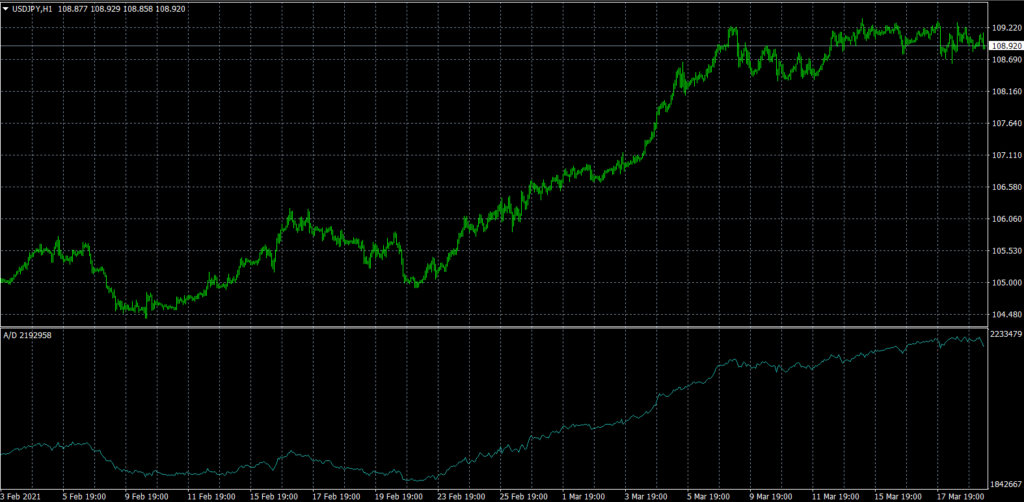
  What Is the Accumulation Distribution Indicator? The A / D metric attempts to identify discrepancies between stock price and volume flow. This gives an indication of the strength of a trend. If the price rises but the indicator falls, it suggests that the volume of purchase or accumulation may not be enough to support the rise and that a fall in price may be imminent. This is how this indicator works 1The actual value of the accumulation distribution is not important. Focus on your direction. 2If the price and the accumulation distribution reach higher highs and lows, the uptrend should continue. 3If the price and the distribution of the accumulation reach lower highs and lows, the downtrend should continue. 4If the accumulation distribution increases in a trading range, accumulation can occur and is a warning of a breakout to the upside. 5If the accumulation distribution falls during a trading range, a distribution can occur and is a warning of a breakout to the downside. The ac...

Elliott Wave Theory

Image
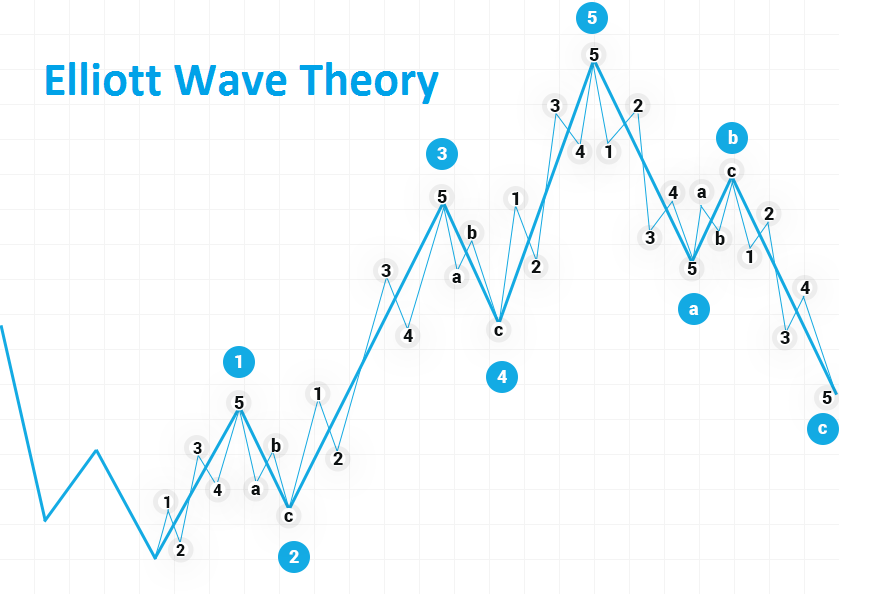
Introduction to Elliott Wave Theory Ralph Nelson Elliott developed Elliott Wave Theory in the 1930s.1 Elliott believed that stock markets, which are generally considered more random and chaotic, were in fact traded in repeating patterns. In this article, we take a look at the history of Elliott's wave theory and its application to trading. WAVES Elliott has suggested that financial price trends system on the psychology of the dominant investor. He found that fluctuations in mass psychology always manifested in the same recurring or "vague" fractal patterns in financial markets. Elliott's theory is similar to Dow's theory in that they both recognize that stock prices move in waves. But because Elliott also recognized the "fractal" nature of markets, he was able to break them down and analyze them in much more detail. Fractals are mathematical structures that repeat themselves over and over on a smaller and smaller scale. Elliott found that stock index pri...

Fibonacci indicator

Image
  What are Fibonacci Retracements? Fibonacci retracements identify key levels of support and resistance. Fibonacci levels are generally calculated after a market has made a big move up or down and appears to have stabilized at a certain price point. Traders plot the key Fibonacci retracement levels of 38.2%, 50%, and 61.8% by drawing horizontal lines on a chart at those price levels to identify areas that the market could retreat to before recovering. initial price movement. How does Fibonacci work in trading? Before examining the mechanics of Fibonacci trading and how it translates into a Fibonacci Forex trading strategy, it is important to first understand the Fibonacci sequence and the unique mathematical properties it offers. The Fibonacci sequence is a sequence of numbers in which after 0 and 1 each number is the sum of the two previous numbers. Lasts indefinitely. 0, 1, 1, 2, 3, 5, 8, 13, 21, 34, 55, 89, 144, 233, 377, 610, 987, 1597, 2584, 4181, 6765 ... There are some inter...

Average Real Range

Image
  Average Real Range The actual average range indicates the volatility of a currency pair. In the foreign exchange market, the volatility measure is very important because it is related to direct market movements. In any financial market, increasing volatility indicates a market reversal and decreasing volatility indicates the continuation of the market. The spread of a stock is the difference between its high and its low on a given day. Provides information on the volatility of a stock. Large ranges indicate high volatility and small ranges indicate low volatility. The range of options and commodities (high minus low) is measured in the same way as for stocks.       How Does this Indicator Work? A rising ATR indicates greater volatility in the market, with the range of each bar increasing. A reversal with a rise in ATR would indicate the force behind that move. ATR is not directional, so expanding ATR may indicate buying or selling pressure. High ATR levels are usua...

How to Apply Stop loss or Take Profit on Trades

Image
  What is Stop Loss?  A stop-loss order is placed by a trader on trade to limit the loss. As the name suggests, a Stop-loss order puts an end to the trade when it reaches the particular amount of loss determined by the trader. It helps investors to prevent large and uncontrollable losses.  Not using the Stop loss order while trading is something that is not recommended to any trader. Not using stop-loss can lead to uncontrollable losses and one may end up wiping out the entire account just in a short period of time.  Types of Stop-loss Orders.  Volatility Stop:   Although Volatility is an important aspect of trading, it can also lead to major losses in investment. Volatility refers to the change in price over a short period of time. Volatility stop-loss order triggers when there is a large price change in the investment being made. This leads to controllable losses and reduces the loss margin.    Time Stop:  As the name suggests, this type o...

COMMODITIES TRADING

Image
 What is Commodities Trading? A commodity refers to any material that has its own intrinsic value and can be exchanged for money or other goods and services. Investment and trade-related commodities include fuels, agricultural products, and metals, etc., which are traded in bulk on a spot market or on a commodity exchange. There are two kinds of raw materials on the market, namely hard raw materials and soft raw materials. Hard raw materials are often used as inputs for the manufacture of other goods and the provision of services, while soft raw materials are used mainly for initial consumption. Inputs such as metals and minerals are classified as hard raw materials, while agricultural products such as rice and wheat are softer raw materials. Since different manufacturers produce the goods available on the bags, the quality is different, but according to some criteria it has to be essentially the same for different manufacturers. Commodities are traded on the spot market or on the ...

Stock Market

Image
How does the stock market work? If the idea of   investing in the stock market scares you, you are not alone. People with very limited experience in investing in stocks are afraid of horror stories in which the average investor will lose 50% of the value of their portfolio, for example, in the two bear markets that have already appeared during this period. Millennial1, or are attracted to "good deals," which promise great rewards but rarely pay off, so it is not surprising that the investment mood pendulum swings between fear and greed. Definition of "share" A share (also called "equity" of a company) is a financial instrument that represents the ownership of a company or corporation and represents a proportional claim on its assets (what it owns) and its earnings (what it owns). Participation means that the shareholder owns a stake in the company equal to the number of shares compared to the total number of shares outstanding in the company. For example, ...