Accumulation Distribution Indicator
What Is the Accumulation Distribution Indicator?
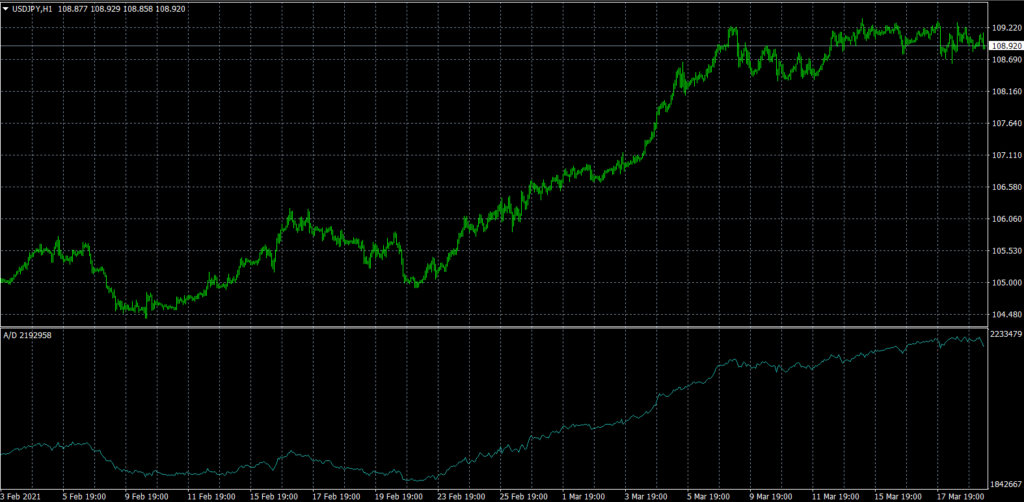
The A / D metric attempts to identify discrepancies between stock price and volume flow. This gives an indication of the strength of a trend. If the price rises but the indicator falls, it suggests that the volume of purchase or accumulation may not be enough to support the rise and that a fall in price may be imminent.
This is how this indicator works
1The actual value of the accumulation distribution is not important. Focus on your direction.
2If the price and the accumulation distribution reach higher highs and lows, the uptrend should continue.
3If the price and the distribution of the accumulation reach lower highs and lows, the downtrend should continue.
4If the accumulation distribution increases in a trading range, accumulation can occur and is a warning of a breakout to the upside.
5If the accumulation distribution falls during a trading range, a distribution can occur and is a warning of a breakout to the downside.
The accumulation distribution line only considers the level of the zone close to the high-low zone during a certain period of time (day, week, month). Line AD ignores the transition from one period to another. With this formula, a security could fall and close considerably lower, but the accumulation distribution line would increase if the closing price were above the midpoint of the high-low range. If the price continues to rise and the accumulation distribution does not, the uptrend is likely to stagnate or fail. This is called negative divergence.
If the price continues to trough lower and the accumulation distribution does not trough lower, the downtrend is likely to stop or fail. This is called positive divergence.
Advantages and disadvantages of the A / D indicator
The accumulation distribution indicator is a good way to measure the strength of the volume behind the price movement. The A / D indicator can determine the pressure to buy and sell shares in the market and, based on this, can provide information on possible changes in share prices. Therefore, the trading position can be estimated based on possible price movements. The A / D line also detects price-volume divergences, which helps traders confirm the strength and durability of the trend. However, the use of the accumulation distribution indicator has certain drawbacks. The A / D indicator does not show price changes between periods; therefore, a number of price differences can go unnoticed. Therefore, the accumulation distribution indicator should be used in conjunction with other aspects of technical analysis and not as a stand-alone indicator read more.


Comments
Post a Comment