Posts

Showing posts with the label #PendingOrders

Rising Three Methods

Image
  Rising Three Methods Bullish Rising Three Methods is a trend continuation pattern that alerts traders to a weakening in the current trend. The long white candle of the first day is followed by three shorter descending candles. The smaller candles reflect trend resistance, which may include a trend reversal. These 3 candlesticks are usually black and part of their body remains within the price action range of the first day. The formation ends on the fifth day with another white candle. The opening price of this candle is higher than the closing price of the first day. The uptrend should continue. The three-way pattern is a trend continuation pattern that can occur in an uptrend or downtrend. In an uptrend it is called a three-way ascending pattern and in a downtrend it is called a three-way descending pattern. The three-way pattern consists of at least five candlesticks, but can contain more. It is similar to flag or pennant formations and also represents a period of congestion or...

Bearish Counter-Attack Candlestick Pattern

Image
What are bearish  counterattack lines? The Counterattack Lines Pattern is a two-candle reversal pattern that appears on candlestick charts. This can happen during an uptrend or downtrend. In a bullish reversal during a downtrend, the first candle is a long black candle (low) and the second candle pulls away but then closes higher near the close of the first candle. This shows that sellers were in control, but could lose control as buyers could fill the void. In a bear reversal during an uptrend, the first candle is a long white (rising) candle and the second candle goes up but then closes lower near the close of the first candle. Counterattack candlestick pattern: an example Understanding the model and what it means becomes much easier when you see it in action. So let's take a look. This is what the bullish counterattack pattern looks like. Take a moment to look at this figure. The bearish candlestick is black while the bullish candlestick is white. Here you can see that prices ar...

Bearish Counter-Attack Candlestick Pattern

Image
  Bearish Counter-Attack Candlestick Pattern The bearish counterattack candlestick pattern is a bearish reversal candlestick pattern. A bearish counterattack candlestick pattern can lead to a quick price reversal to the downside. An uptrend has been underway for some time, and bullish investors are comfortable with the momentum in the stock price. A bearish counterattack candlestick pattern starts with too much of the same, maybe even too much of an anniversary, as price opens with a gap from the close of the previous candlestick pattern. Bullish investors feel good about the gap this morning. But somewhere in the middle of the trading period, things change. Investors sell shares, and at the end of the trading period, the closing price of the candle is equal to or even slightly lower than the closing price of the previous candle. Hence the naming convention "counterattack".     How to Use the Counterattack Candlestick Pattern?   Recognizing the pattern is one thing. ...

The Neck Candlestick Pattern

Image
What is in The Neck Candlestick Pattern? The pattern at the neckline occurs when a long real-body bearish candle is followed by a smaller real-body rising candle that widens at the open but then closes near the close of the previous candle. The pattern is called a cleavage because the two closes are the same (or nearly the same) on both candles, forming a horizontal cleavage. In theory, the pattern is considered a continuation pattern, which indicates that the price will continue to fall following the pattern. In reality, this only happens half the time. As such, the pattern often suggests at least a short-term bullish reversal. What Does the Neckline Candlestick Pattern tell Traders? The candlestick pattern at the neckline informs traders of the possibility of the current trend in the market continuing. If the study is exhaustive, it also sheds light on the general behavior of the market in which it occurs. The appearance of the first bearish candle indicates the strength of the bears...

What is a Marubozu candlestick pattern?

Image
What is a Marubozu candlestick pattern? A Marubozu candlestick pattern is a stock chart pattern that can help investors gain insight into market sentiment at any time. Although Marubozu's model performs quite well when spotted, it remains relatively unpopular with investors. We take a look at the basics and key features of the model so you can start harnessing the power of this little-known stock market predictor. Marubozus are full-bodied bullish or bearish candlesticks with no upper wicks or lower shadows. Marubozus are usually green or white when they are bullish and red or black when they are bearish on stock charts. What are the pros and cons of using the Marubozu candlestick pattern? An important point to keep in mind when researching Marubozu candles is that while you should never trade in the same direction as the candles, you should definitely trade against them. Given the trading activity that is driving this pattern, if the market continues to move in this direction, you...

Hammer Candlestick pattern

Image
What is the hammer candlestick pattern? When the opening and closing prices are almost the same, it shows that the bulls have taken control of the prices. Since Hammer is a bullish reversal chandelier model, it should form at the end of a downtrend. The long shadow below shows that the bears initially pushed prices too low near the support. But then the bulls came along and eventually pushed the price higher and closed above the opening price. There is a difference between the hammer and the inverted hammer in terms of training. The inverted hammer candlestick is the inverted version of the hammer. What does the hammer candlestick pattern tell you? As seen above, Hammer forms after the stock price falls, indicating that prices are trying to bottom out. The hammers indicate that the bears have lost control of the prices, which suggests a possible reversal of the uptrend. It should be noted that this candle should form after 3 or more bearish candles as it gives more confirmation. Confir...

Candlestick Chart

Image
 The 3 Most Powerful Candlestick Chart Patterns Candlestick charts are a technical tool that groups data from multiple timeframes into individual price bars. This makes them more useful than traditional open-high, low-close bars or simple lines connecting closing price points. Candlesticks form patterns that predict the direction of prices when they end. Proper color coding adds depth to this colorful technical tool, which dates back to 18th-century Japanese rice traders. Steve Nison introduced Japanese candlestick patterns to the Western world in his popular 1991 book, Candlestick Charting Techniques.1 Many traders today can identify dozens of these patterns, which have colorful names like bearish cloud cover, evening star, and bearish cloud cover. three black ravens. Additionally, single bar patterns including Doji and Hammer have been incorporated into dozens of long and short trading strategies. 1. Spinning Top When trading stock markets or other liquid and risky asset classes,...

Accumulation Distribution Indicator

Image
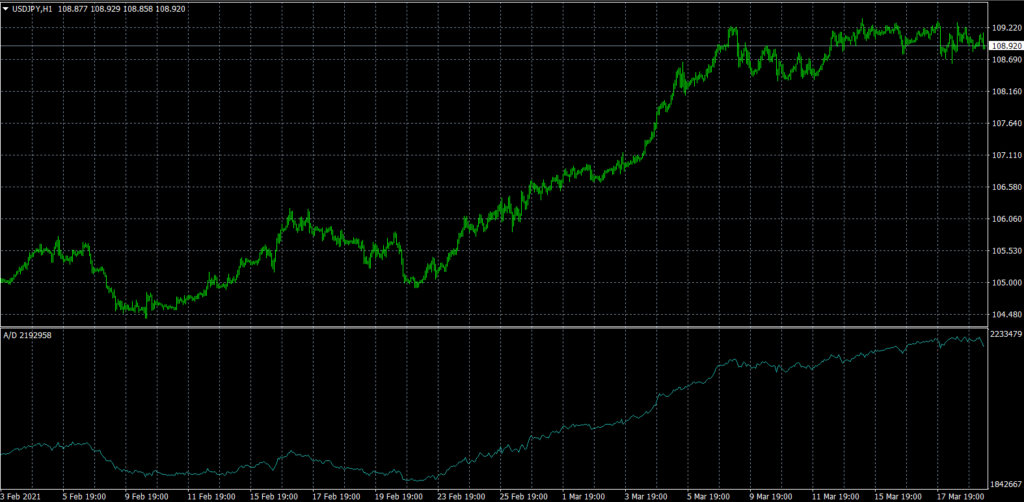
  What Is the Accumulation Distribution Indicator? The A / D metric attempts to identify discrepancies between stock price and volume flow. This gives an indication of the strength of a trend. If the price rises but the indicator falls, it suggests that the volume of purchase or accumulation may not be enough to support the rise and that a fall in price may be imminent. This is how this indicator works 1The actual value of the accumulation distribution is not important. Focus on your direction. 2If the price and the accumulation distribution reach higher highs and lows, the uptrend should continue. 3If the price and the distribution of the accumulation reach lower highs and lows, the downtrend should continue. 4If the accumulation distribution increases in a trading range, accumulation can occur and is a warning of a breakout to the upside. 5If the accumulation distribution falls during a trading range, a distribution can occur and is a warning of a breakout to the downside. The ac...

Fibonacci indicator

Image
  What are Fibonacci Retracements? Fibonacci retracements identify key levels of support and resistance. Fibonacci levels are generally calculated after a market has made a big move up or down and appears to have stabilized at a certain price point. Traders plot the key Fibonacci retracement levels of 38.2%, 50%, and 61.8% by drawing horizontal lines on a chart at those price levels to identify areas that the market could retreat to before recovering. initial price movement. How does Fibonacci work in trading? Before examining the mechanics of Fibonacci trading and how it translates into a Fibonacci Forex trading strategy, it is important to first understand the Fibonacci sequence and the unique mathematical properties it offers. The Fibonacci sequence is a sequence of numbers in which after 0 and 1 each number is the sum of the two previous numbers. Lasts indefinitely. 0, 1, 1, 2, 3, 5, 8, 13, 21, 34, 55, 89, 144, 233, 377, 610, 987, 1597, 2584, 4181, 6765 ... There are some inter...

Major Markets of Forex

Image
The currency market The currency market is also known as the Forex or FX market. Currently, it works with telecommunications technology and remains active 24 hours a day, allowing OTC transactions in individual currencies between two participants, each individual currency being its own markets, such as the USD market or the GBP market. The forex market also experiences a high volume of interbank transactions, which often determine the value of currencies. Currency markets emerged due to the need for traders to conduct international business. Currency markets remain the oldest financial markets and have a voice in global financial liquidity.  Which countries have the largest foreign exchange markets?  As with many established markets, some of the top entrants control significantly more volume than the rest of the list combined.  In the forex market, this largely belongs to the Group of 10, also known as G10 coins. These coins are listed according to market share:   Un...

How to Apply Stop loss or Take Profit on Trades

Image
  What is Stop Loss?  A stop-loss order is placed by a trader on trade to limit the loss. As the name suggests, a Stop-loss order puts an end to the trade when it reaches the particular amount of loss determined by the trader. It helps investors to prevent large and uncontrollable losses.  Not using the Stop loss order while trading is something that is not recommended to any trader. Not using stop-loss can lead to uncontrollable losses and one may end up wiping out the entire account just in a short period of time.  Types of Stop-loss Orders.  Volatility Stop:   Although Volatility is an important aspect of trading, it can also lead to major losses in investment. Volatility refers to the change in price over a short period of time. Volatility stop-loss order triggers when there is a large price change in the investment being made. This leads to controllable losses and reduces the loss margin.    Time Stop:  As the name suggests, this type o...