Posts

Showing posts with the label HammerCandlestickpattern

Rising Three Methods

Image
  Rising Three Methods Bullish Rising Three Methods is a trend continuation pattern that alerts traders to a weakening in the current trend. The long white candle of the first day is followed by three shorter descending candles. The smaller candles reflect trend resistance, which may include a trend reversal. These 3 candlesticks are usually black and part of their body remains within the price action range of the first day. The formation ends on the fifth day with another white candle. The opening price of this candle is higher than the closing price of the first day. The uptrend should continue. The three-way pattern is a trend continuation pattern that can occur in an uptrend or downtrend. In an uptrend it is called a three-way ascending pattern and in a downtrend it is called a three-way descending pattern. The three-way pattern consists of at least five candlesticks, but can contain more. It is similar to flag or pennant formations and also represents a period of congestion or...

Bearish Counter-Attack Candlestick Pattern

Image
What are bearish  counterattack lines? The Counterattack Lines Pattern is a two-candle reversal pattern that appears on candlestick charts. This can happen during an uptrend or downtrend. In a bullish reversal during a downtrend, the first candle is a long black candle (low) and the second candle pulls away but then closes higher near the close of the first candle. This shows that sellers were in control, but could lose control as buyers could fill the void. In a bear reversal during an uptrend, the first candle is a long white (rising) candle and the second candle goes up but then closes lower near the close of the first candle. Counterattack candlestick pattern: an example Understanding the model and what it means becomes much easier when you see it in action. So let's take a look. This is what the bullish counterattack pattern looks like. Take a moment to look at this figure. The bearish candlestick is black while the bullish candlestick is white. Here you can see that prices ar...

The Neck Candlestick Pattern

Image
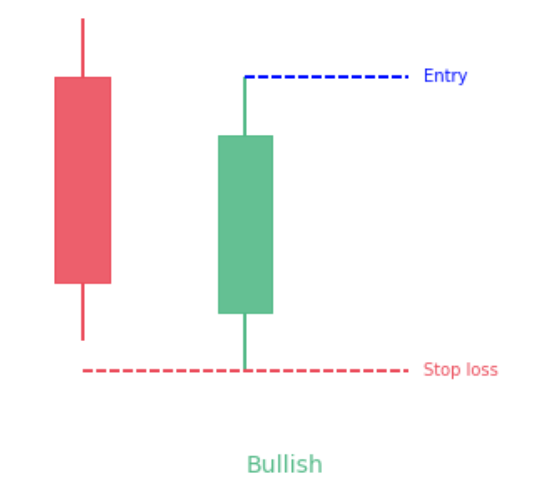
What is in The Neck Candlestick Pattern? The pattern at the neckline occurs when a long real-body bearish candle is followed by a smaller real-body rising candle that widens at the open but then closes near the close of the previous candle. The pattern is called a cleavage because the two closes are the same (or nearly the same) on both candles, forming a horizontal cleavage. In theory, the pattern is considered a continuation pattern, which indicates that the price will continue to fall following the pattern. In reality, this only happens half the time. As such, the pattern often suggests at least a short-term bullish reversal. What Does the Neckline Candlestick Pattern tell Traders? The candlestick pattern at the neckline informs traders of the possibility of the current trend in the market continuing. If the study is exhaustive, it also sheds light on the general behavior of the market in which it occurs. The appearance of the first bearish candle indicates the strength of the bears...

Tweezer Bottom and Top Candlestick Patterns

Image
How to Trade the Tweezer Bottom and Top Candlestick Patterns. The depth of the lower shadows of this signal indicates a support zone. The bears were unwilling to sell below that low price, so the bulls came back with great force, driving the price higher. The fact that two or more shadow candles have formed at the same level confirms the strength of the support and shows that the downtrend is likely to continue or turn into an uptrend.  Like the high tweezers, this signal is considered a short-term minor reversal pattern. To better understand its meaning, pay attention to these characteristics: 1When this model appears at the bottom of the market, it is more reliable. 2If the first candle has a high body and the second one has a short body, then the reversal will be more reliable. 3If the bottom of the tweezer is followed by another reversal pattern, such as B. an engulfing or bullish piercing pattern, with identical lows, this is even more reliable. The Tweezers Top and Tweezers B...

Three White Soldiers

Image
  Three White Soldiers Definition The Three White Soldiers candlestick pattern is unusual in that its meaning depends on its context. However, the pattern itself is easy to spot. This training is simply three days in a row with a white candle, each higher than the last. The apparition is of three white soldiers standing in a row, hence the name. The bullish significance of this formation is easy to guess. But how reliable is this indicator?   This indicator is quite strong and very reliable in most situations, indicating an accumulation of bullish strength. For example, when a market is flat or moving mostly sideways, the three white soldiers indicate that the bulls are gaining ground. When the market has entered a downtrend, this candlestick pattern indicates a reversal. However, when the market is constantly progressing, the three white soldiers are considered less important. That's because they fit the current blueprint and aren't even really considered a sequel.   How...

Morning Star

Image
 The Morning Star For the sake of simplicity, a bearish candlestick is one in which the stock's closing price is lower than its opening price, meaning that the price has fallen during the day. In contrast, a bullish candlestick is one where the closing price is higher than the opening price because the price has risen throughout the day. With that in mind, let us know as we take a closer look at the construction and key features of this popular candlestick pattern. What is the difference between Morning Star and Evening Star candlestick patterns? The main difference between the Morning Star and Evening Star candlestick patterns is that the Morning Star is considered a bullish indicator, while the Evening Star is considered a bearish indicator. The Evening Star has the center candle at a higher high than the two side candles with a gap up followed by a gap down, while the Morning Star has the center candle at its highest low with a gap down followed by a gap up. An example of a morn...

Bullish Engulfing Pattern.

Image
  What is a Bullish Engulfing Pattern? A bullish engulfing pattern is a white candlestick that closes above the previous day's open after opening below the previous day's close. It can be recognized when a small black candlestick indicating a downtrend is followed the next day by a large white candlestick indicating an uptrend, the body of which completely covers or engulfs the body of the previous day's candlestick. A bullish engulfing pattern can be contrasted with a bearish engulfing pattern. With a single candlestick pattern, the trader only needed one candlestick to spot a trading opportunity. However, when analyzing multiple candlestick patterns, the trader needs 2 or sometimes 3 candlesticks to identify a trading opportunity. This means that the trading opportunity develops for at least 2 trading sessions. What Is a Bullish Engulfing Pattern? To find bullish engulfing patterns, look for these two candlesticks side by side: A small red candlestick, usually at the end ...

PIERCING PATTERN

Image
WHAT IS A PIERCING PATTERN? The piercing line pattern is considered a bullish reversal candlestick pattern at the bottom of a downtrend. This often results in a trend reversal when bulls enter the market and push prices higher. The piercing pattern features two candles, with the second bullish candle opening lower than the previous bearish candle. This is followed by buyers pushing prices past the 50% bearish candlestick body . How a Piercing Pattern Works A piercing pattern has two days where the first day is decidedly influenced by sellers and the second day is answered by enthusiastic buyers. This may indicate that the supply of shares that market participants are looking to sell has dried up a bit and the price has fallen to a level where the demand to buy shares has increased and increased. This momentum appears to be a reasonably reliable indicator of a short-term bullish outlook. How to identify Piercing Patterns? First of all, it should be considered that the pattern formulatio...

Hammer Candlestick pattern

Image
What is the hammer candlestick pattern? When the opening and closing prices are almost the same, it shows that the bulls have taken control of the prices. Since Hammer is a bullish reversal chandelier model, it should form at the end of a downtrend. The long shadow below shows that the bears initially pushed prices too low near the support. But then the bulls came along and eventually pushed the price higher and closed above the opening price. There is a difference between the hammer and the inverted hammer in terms of training. The inverted hammer candlestick is the inverted version of the hammer. What does the hammer candlestick pattern tell you? As seen above, Hammer forms after the stock price falls, indicating that prices are trying to bottom out. The hammers indicate that the bears have lost control of the prices, which suggests a possible reversal of the uptrend. It should be noted that this candle should form after 3 or more bearish candles as it gives more confirmation. Confir...