Forex chart
What is a Forex chart?
A currency chart graphically displays the historical behavior of relative price movement between currency pairs during different time periods. Technical analysts and daily traders will examine these charts to identify trends and various patterns that can indicate reversals, continuations, entry points, and exits. Many traders use forex charting software to determine the likely direction of a particular currency pair in conjunction with other technologies, such as predictive forecasting software and online trading, to gain an edge in the forex markets.
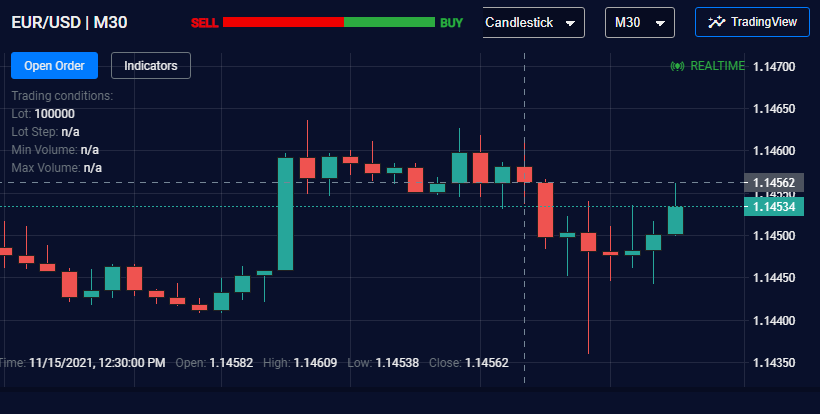
Chart Types
Charts usually have several different display modes to show price. One method by which the price can be displayed is called Japanese candlesticks. Candlestick charts are the most common display method for displaying prices on a forex chart. There are theories about using candlestick patterns to predict price. Candlestick analysis is designed to provide an almost instantaneous measure of sentiment in the market. The price can also be displayed as a line. Line charts are a great way to make the price easier to visualize. The line chart shows the closing price for each period. Another way to see the price is to use a bar chart. The bar chart is similar to the candlestick chart. A bar chart shows you where the price opened, the high and the low, and where the price closed.
Technical Analysis
One of the best reasons to learn to read a chart correctly is to do technical analysis. Not all traders believe in technical analysis, but it can be useful even if it is not their main trading method. Technical analysis is based on the price that is on the chart that you are using. Most charting systems allow you to add technical analysis tools as an overlay to your chart.
How to Read Forex Charts
The ability to accurately read and interpret forex charts is essential for successful trading in the forex markets. When you learn to read live forex charts, as well as real-time trading charts, you can take control and spot trends. Forex charts show a period of time that depends on the selected period. Most forex charts have a default daily duration that displays trading data over a 24-hour period. However, this can be changed for periods representing minutes or even months, depending on your needs. This ability to navigate currency charts for short and long periods allows you to fully monitor fluctuations in exchange rates Read More...


Comments
Post a Comment