What is Ichimoku Kinko Hyo?
What is Ichimoku Kinko Hyo?
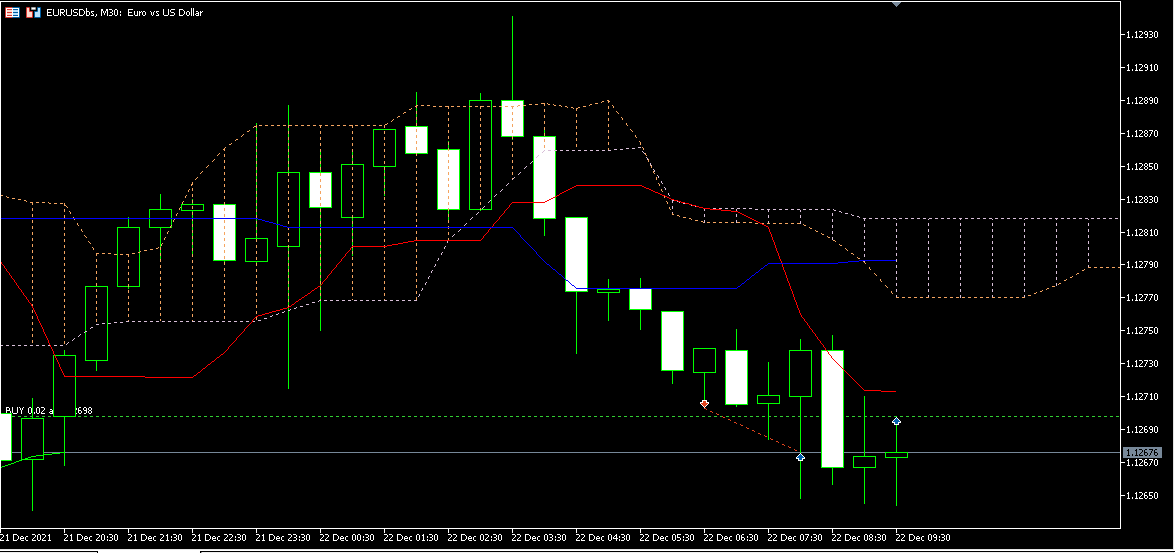
Ichimoku Kinko Hyo, or Ichimoku for short, is a technical indicator used to measure momentum as well as future support and resistance areas. The all-in-one technical indicator is made up of five lines named Tenkan-Sen, Kijun-Sen, Senkou Span A, Senkou Span B, and Chikou Span.
Ichimoku Cloud Explained
The Ichimoku cloud indicator consists of 5 rows calculated as follows:
1 Tenkan Sen
Tenkan Sen = (9 high periods + 9 low periods) / 2
Tenkan Sen, also known as the conversion line, is usually red in color and is represented by the moving average of the midpoints of the last 9 periods.
2 Kijun Sen
Kijun Sen = (26 high periods + 26 low periods) / 2
Kijun Sen, also known as the baseline, is generally white in color and is represented by the moving average of the midpoints of the last 26 periods.
3Senkou Span A.
Senkou section A = (Tenkan Sen + Kijun Sen) / 2
Typically yellow in color, Senkou Span A is drawn as the midpoint of Tenkan Sen and Kijun Sen, with the line projecting 26 periods into the future.
4Senkou Span B
Senkou Span B = (maximum of 52 periods + minimum of 52 periods) / 2
Generally blue, Senkou Span B is represented as the moving average of the midpoints of the past 52 periods, with the line projecting 26 periods into the future.
5Chikou-Spain
Generally green, Chinkou Span is the current closing price, set back 26 periods.
These are the Senkou Span lines that form the boundaries of the "cloud". When Senkou Span A is above Senkou Span B, the cloud's shadow is generally green; and when Senkou Span B is above Senkou Span A, the cloud's shadow is usually red.
Advantages of The Ichimoku System
1Can be used in almost any trading market, including equity, futures and options, currency, indices, and precious metals (gold and silver) markets, etc.
2Ichimoku allows you to quickly select trade settings or preferences at a glance, including the instant understanding of the direction of price movement, sentiment, momentum, and trend strength.
3Ichimoku shows a very clear picture as it shows a large amount of data, which offers greater reliability in understanding the price movement. This technique combines three indicators in a single chart that allows the trader to make a more informed decision.
4Ichimoku is a trend detection chart system. That is, it works best in markets with clear trends. It helps to find the direction of the price movement so that the trader has a good understanding of the trends in general.
5It is possible to spot false price breakouts with Ichimoku as this system helps you to grasp the direction of the trend in the trading time frame read more.


Comments
Post a Comment